
Feature reference v8.52
Full feature breakdown
Every major capability in HWiNFO64 and HWiNFO ARM64, grouped by how technicians and enthusiasts actually use the tool.
System tree
Hardware inventory
The System Summary and hierarchical tree enumerate every major component: CPU, motherboard, BIOS, memory modules, storage, network adapters, audio devices, and PCIe peripherals. Each node expands to show firmware revisions, serial numbers where available, and link speeds.
Memory SPD pages list manufacturer, part number, rated speed, voltage, and XMP or EXPO profiles. Storage nodes surface SMART attributes, temperature, and power-on hours. PCI devices report negotiated link width and generation.
Use this view to verify a new build, compare against a purchase order, or attach a report to a support ticket. For export options see reports and export.
Read inventory guides →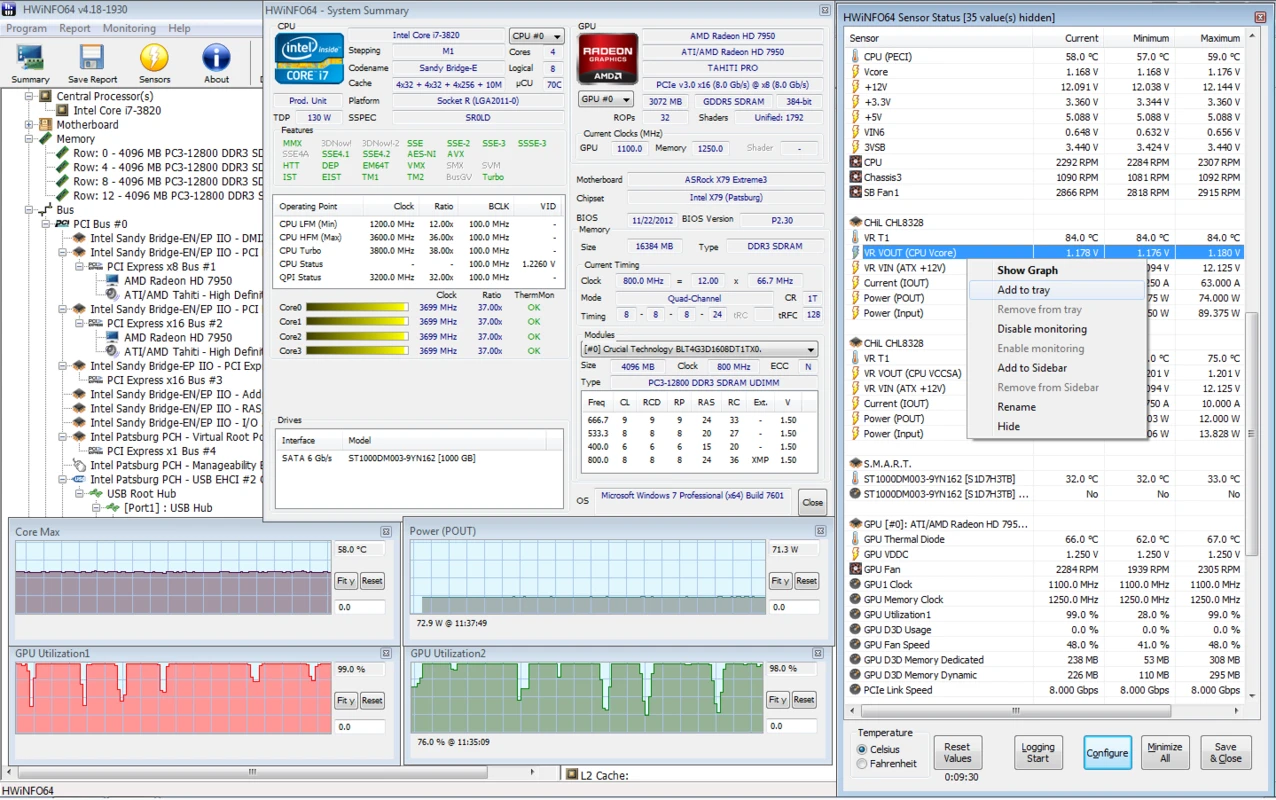
Processor
CPU and chipset analysis
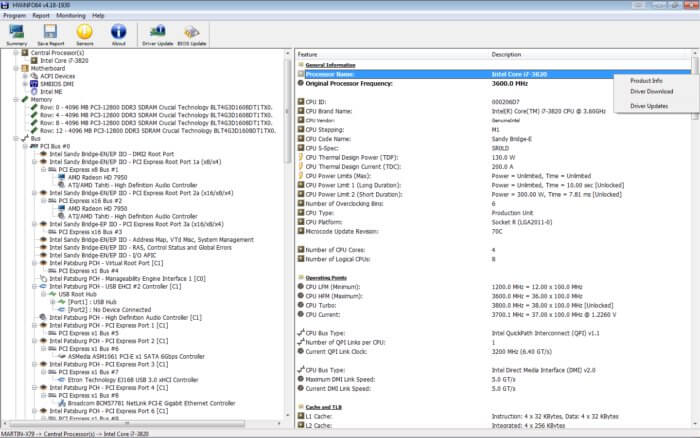
HWiNFO reads CPUID leaves, microcode revision, cache topology, and per-core effective clock. Chipset and platform controller hub data explain memory channels, PCIe lane allocation, and power delivery limits reported through ACPI and vendor-specific interfaces.
- Microarchitecture
- Codename, stepping, base and boost clocks, thermal design power, and per-core topology for Intel, AMD, and ARM64 SoCs.
- Cache hierarchy
- L1, L2, and L3 sizes per cluster with associativity and latency where the CPU exposes them.
- Platform limits
- Package power tracking, PL1 and PL2 windows, VRM telemetry on supported boards, and memory controller ratios.
- Error counters
- WHEA hardware error counts for corrected and uncorrected events, useful before RMA discussions.
Ryzen temperature rows can be confusing on first open. See temperature guide for which reading matches your workload.
Live telemetry
Real-time sensor monitoring
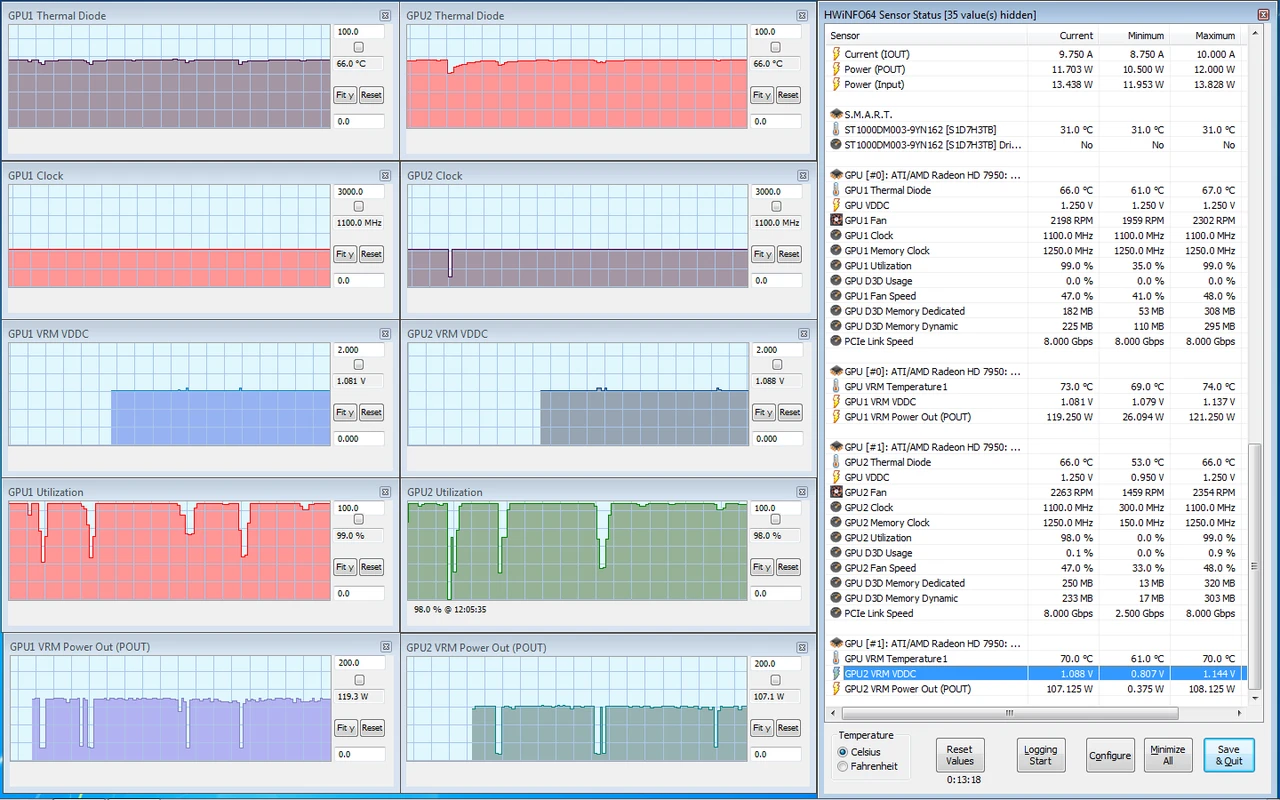
The Sensor Status window polls embedded controllers on a configurable interval. Each row shows current, minimum, maximum, and average values. Graph columns plot trends for temperatures, voltages, fan RPM, GPU load, and power draw.
Reset min and max before a stress test for clean baselines. Custom labels and sensor filtering help hide unused rows on busy boards. Pair with alerts and logging to capture threshold crossings.
Thresholds
Alerts and sensor logging
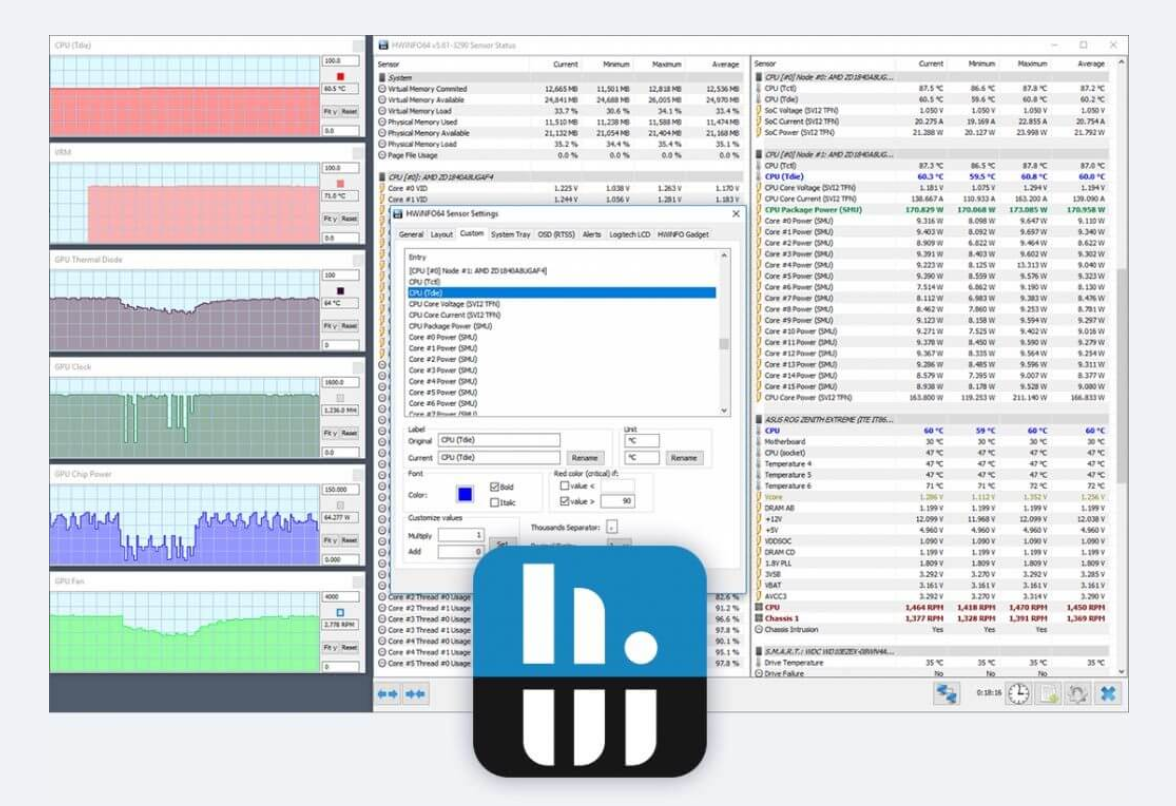
Configure per-sensor alerts when values cross upper or lower bounds. Actions include on-screen popups, audible beeps, running a program, sending email through an SMTP profile, or writing to the Windows Event Log.
Sensor logging records selected rows to disk at the polling interval. Timestamped CSV files help correlate game crashes, render failures, or shutdowns with thermal or power spikes. Logging runs in the background while the main windows stay open or minimized to the tray.
Set conservative thresholds on VRM and NVMe temperatures first. Adjust after observing typical load behavior. If alerts never fire, confirm the correct sensor row in sensor troubleshooting.
Logging setup guide →Output formats
Reports and export
Save the full system report or sensor snapshots in multiple formats. HTML suits human review. CSV and JSON suit spreadsheets and automation. YAML supports structured pipelines on 64-bit builds.
| Format | Contents | Typical use | Build support |
|---|---|---|---|
| CSV | Sensor logs, selected rows with timestamps | Excel analysis, long session plots | HWiNFO64, ARM64 |
| HTML | Full system report with tree structure | Client deliverables, RMA attachments | HWiNFO64, ARM64 |
| JSON | Structured sensor and system data | Dashboards, scripted monitoring | HWiNFO64 (v8.48+) |
| YAML | Human-readable structured export | Config repos, diff-friendly archives | HWiNFO64 (v8.48+) |
Report generation does not require Pro for personal use. Commercial environments need a Pro license after the 14-day evaluation. See licensing and export walkthrough.
Overlays
OSD and third-party integrations
On-screen display renders selected sensor values over fullscreen games and creative apps. Position, font, color, and background opacity are configurable per item. The free build supports five OSD entries; Pro removes that limit.
Shared memory and registry interfaces expose live values to Rainmeter skins, AIDA64 SensorPanel imports, and custom scripts. Rainmeter reads the published registry keys documented in the HWiNFO help file. Match bitness: 64-bit skins need HWiNFO64.
Remote sensor monitoring through Pro lets a technician watch fleet machines from one console. For OSD placement conflicts with other overlays, see OSD guide.
Integration setup →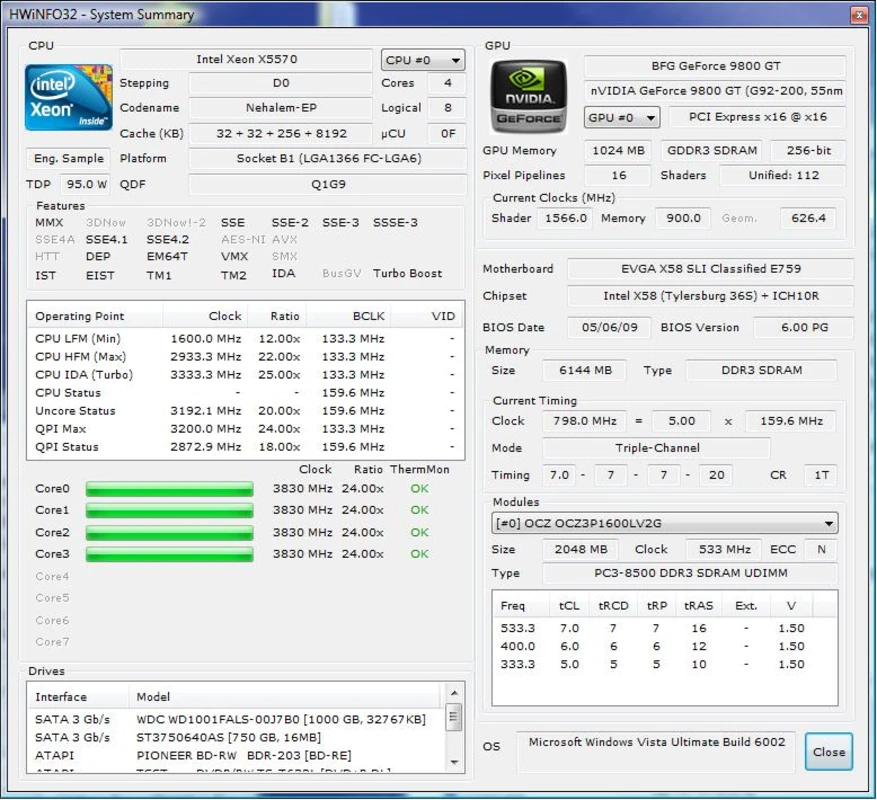
Validation
Benchmarking workflow
HWiNFO is not a synthetic benchmark suite. It validates hardware behavior while you run Cinebench, games, or custom loads by pairing sensor logging with stable baselines.
-
Reset sensor statistics
Open Sensor Status and reset min, max, and average columns. Confirm polling interval matches your test length (500 ms for short bursts, 2000 ms for long sessions).
-
Start logging
Enable sensor logging for CPU package power, hottest CPU temperature, GPU Hot Spot, and any VRM row your board exposes. Choose CSV for spreadsheet review.
-
Run your workload
Execute the benchmark or game session without alt-tabbing if OSD is active. Watch for thermal throttling through Effective Clock drops or power limit flags.
-
Review and archive
Stop logging, export an HTML system report for static specs, and store CSV logs with the test date. Compare runs after BIOS or driver updates.
-
Set alert thresholds
Use observed peaks to configure alerts for the next session. Document findings in benchmark best practices.
Ready to inspect your system?
Download HWiNFO 8.52 for Windows x64 or ARM64. Free for non-commercial use.